Monitoring notes with Grafana, Loki and Promtail
Throughout my professional life it is common to see many types of implementations regarding development and infrastructure; in short, when it comes to infrastructure it is common that there is no service monitoring on an organization's servers, this is more common on on-premise servers, and for this reason I asked myself a few questions.

- How long does it take to build a monitoring system?
- How complex can it be to implement a monitoring system?
- What computing capacity do I need to have a monitoring system?
- How many monitoring systems exist and can I use?
For this article I made a proof of concept taking advantage of a discount on CONTABO VPS servers, we built simple infrastructure, installed some honeypots to collect data, and generated traffic to obtain metrics and create graphs.
| Server | Specification |
|---|---|
| CPU | AMD 4 Cores |
| RAM | 8GB |
| SSD | 150 GB |
| OS | Debian Trixie 13 |
Why do we have to monitor?
We have to monitor because we need to be aware of what is happening in our infrastructure before problems appear, complaints arrive and security incidents occur. Monitoring allows us to:
- Detect ongoing attacks, from brute force attacks, port scans, malicious IPs.
- Identify problems before they escalate, 5xx errors on web servers, SSL certificates about to expire, downed services.
- Understand the server's behavior, traffic and network demand, usage patterns, most queried domains.
- Have evidence to make decisions, real data about what is happening, not assumptions.
- Respond faster to incidents, with centralized dashboards the information is a glance away.
It is often thought that building a monitoring system is about a complex system that requires specialized hardware, software licenses and advanced security knowledge, but the idea is to have the minimum necessary so as not to be blind (for small infrastructures).
Monitoring systems
There are different types of monitoring systems, some general-purpose, others with a specific purpose:
- Zabbix, an infrastructure monitoring platform that allows you to supervise servers, networks, applications, databases and services. It uses agents, SNMP and other protocols to collect metrics and generate alerts.
- Nagios - Icinga, infrastructure and service monitoring solutions. They allow you to verify availability, status and performance through plugins. Icinga started as a fork of Nagios and maintains compatibility with much of its ecosystem.
- PandoraFMS, a comprehensive monitoring platform for infrastructure, networks, servers, applications and services. It allows you to collect metrics, generate alerts, visualize states and perform both local and remote monitoring.
- Grafana - Loki - Promtail, a stack mainly oriented to observability and log management. Grafana provides dashboards with visualization, Loki stores and queries logs, and Promtail collects and sends the logs to Loki.
- Wazuh, allows you to monitor endpoints, analyze logs, detect threats, perform vulnerability analysis, file integrity monitoring (FIM) and generate security alerts.
- ELK Stack (Elasticsearch, Kibana, Beats and Logstash), a log and data management and analysis platform. Elasticsearch stores and indexes data, Logstash performs ingestion and transformation, Beats collects information from systems and services, and Kibana provides visualization, dashboards and analysis.
We do not want to make this article too long; the simple monitoring we will do will be with Grafana - Loki - Promtail, using data from the system logs, with agents that have access to the data of the services we want to monitor.
Important note: Currently, Promtail is in the process of being replaced within the Grafana ecosystem by Grafana Alloy.
Grafana - Loki - Promtail
The solution is made up of three tools from the Grafana ecosystem, all of them open source:
| Component | Function | Port |
|---|---|---|
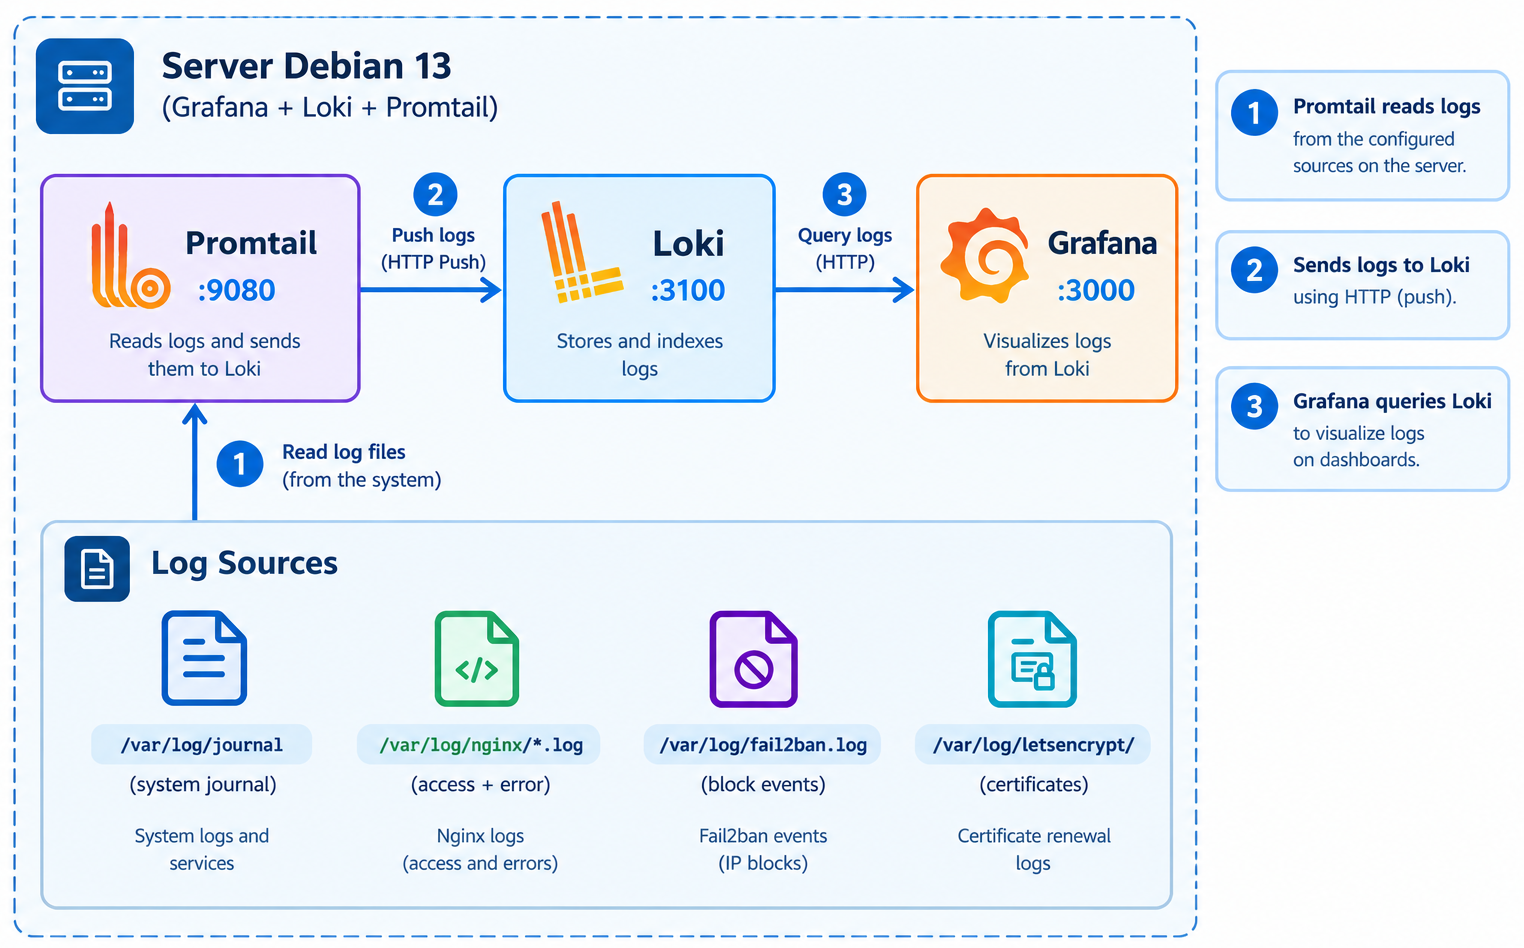
| Promtail | Agent that collects system logs and sends them to Loki | 9080 |
| Loki | Storage and indexing engine for logs | 3100 |
| Grafana | Web interface for visualization and dashboards | 3000 |
The flow is simple: Promtail reads the log files and the systemd journal, sends them to Loki which stores and indexes them, and Grafana queries Loki to display the information in dashboards.
Why only Grafana - Loki - Promtail?
- No additional metrics agents required, all the information comes from logs that already exist on the server.
- Low resource consumption, Loki does not index the full content of the logs, only the labels, which makes it much lighter than Elasticsearch.
- Simple installation, the three components are installed from the official Grafana repository with
apt. - LogQL, Loki's query language is powerful and lets you extract metrics directly from the logs.
What are we going to monitor?
Our test will only monitor services such as SSH, Nginx, Fail2ban and Docker.
1. SSH
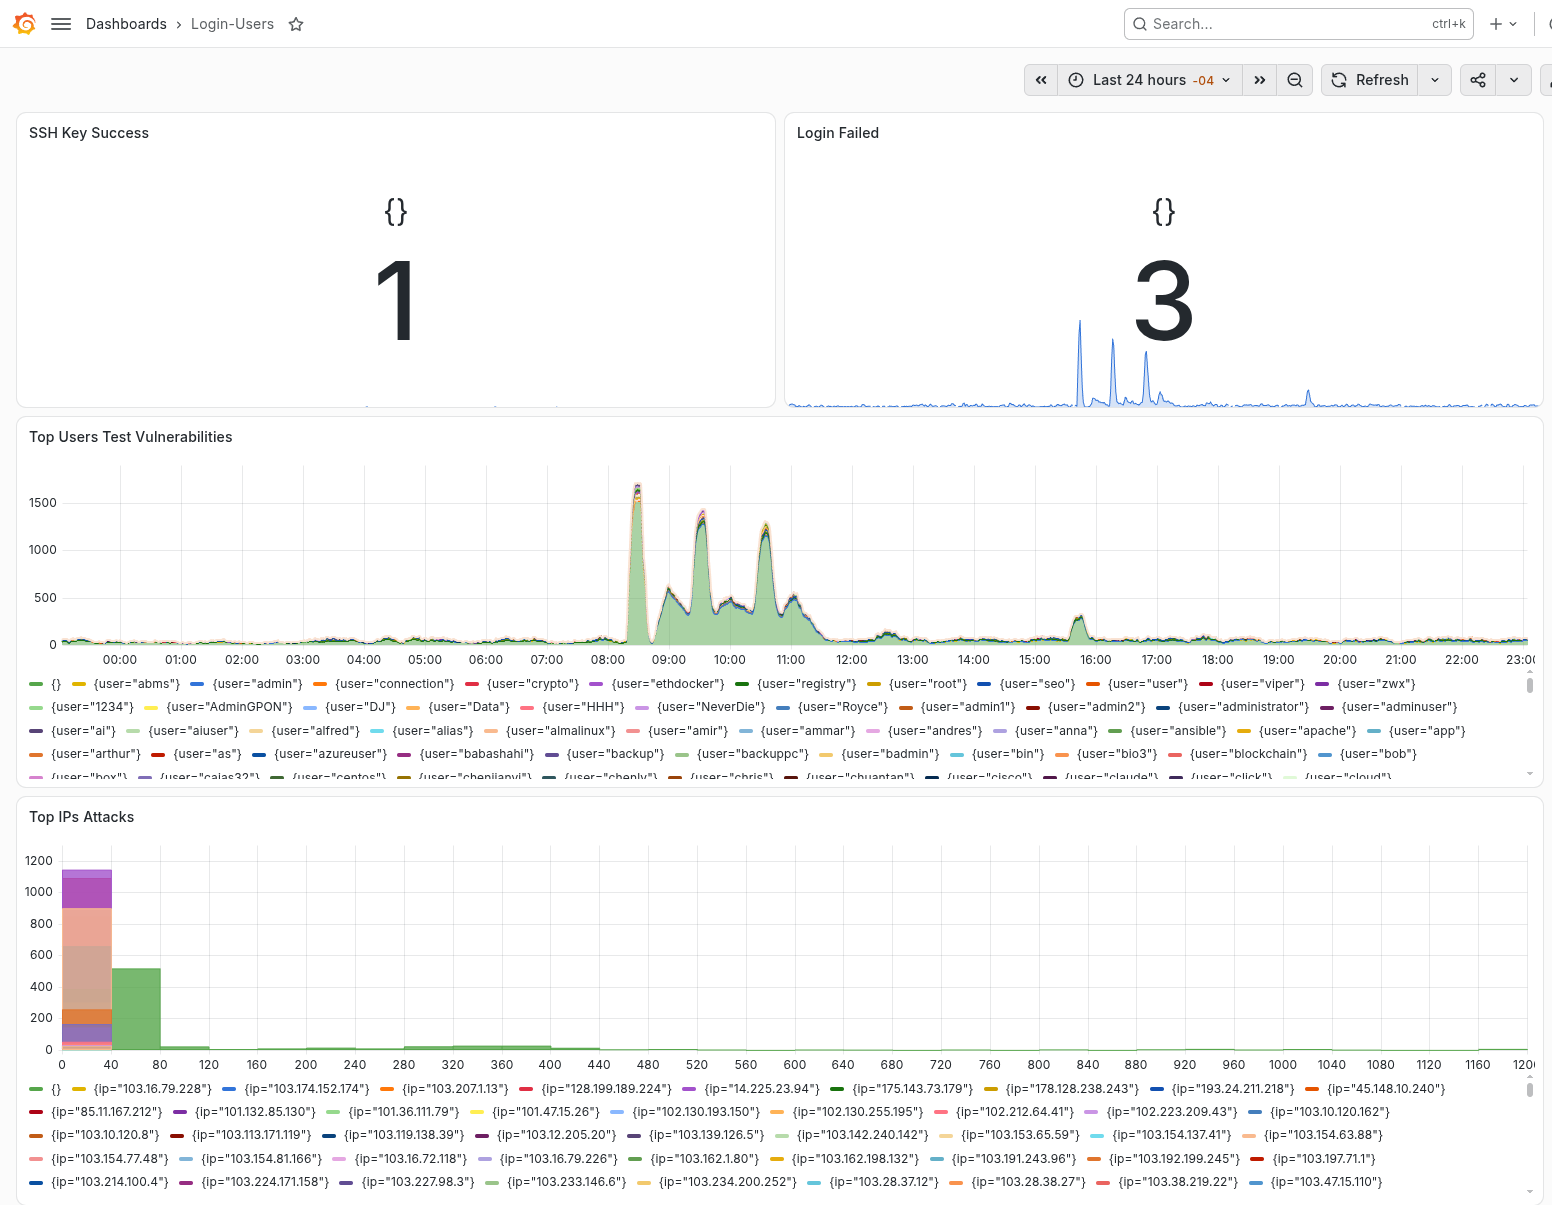
Many of us know SSH; it lets us connect remotely to a server that has this service installed, the default port is 22. Monitoring this service is very important because it allows us to detect:
- Failed login attempts, brute force.
- Successful logins, verify that only authorized users are accessing.
- Source IPs, of each attempt.
- Attempted usernames, by attackers.
2. Nginx
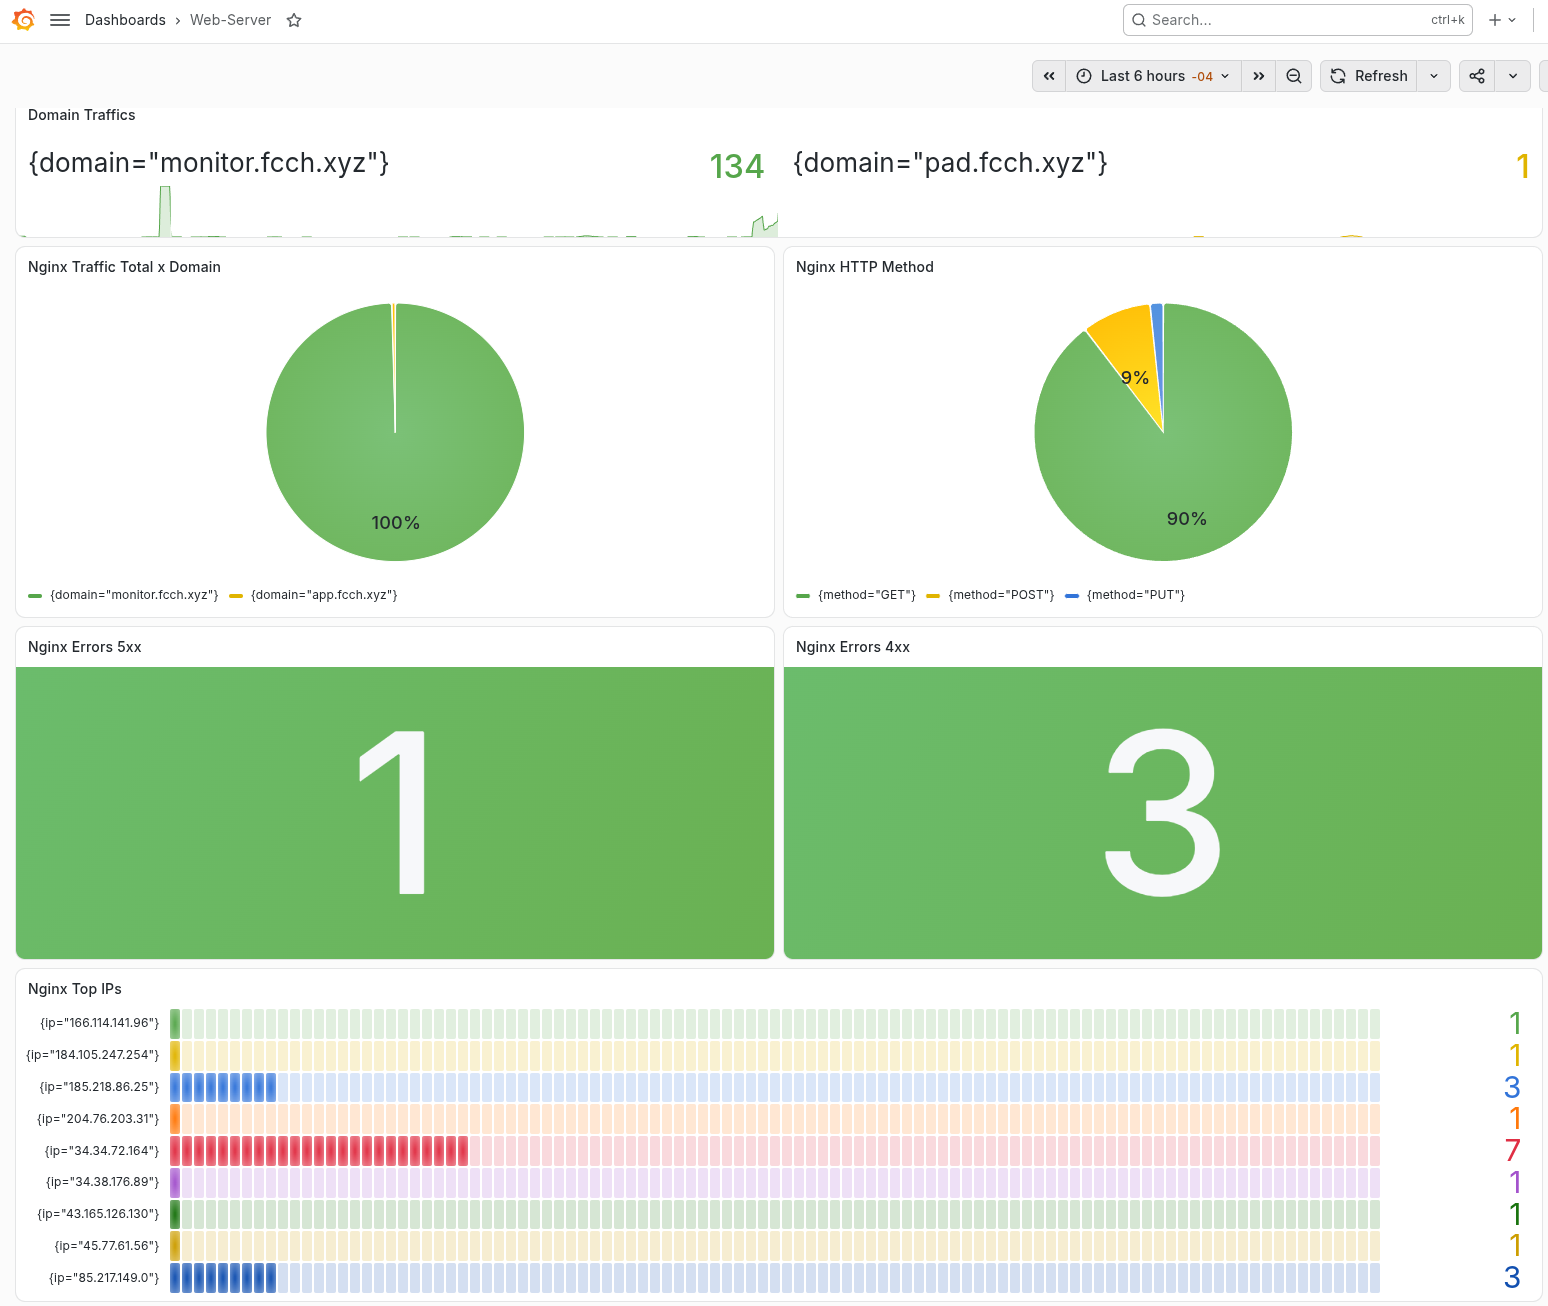
For web servers the minimum worth monitoring is the traffic:
- Requests per second/minute, detect high or low traffic demand.
- HTTP status codes, how many 4xx and 5xx errors are being produced.
- Top IPs, identify who is generating the most traffic.
- Top URLs, which resources are the most requested.
- Error logs, visualize server errors in real time.
3. Fail2ban
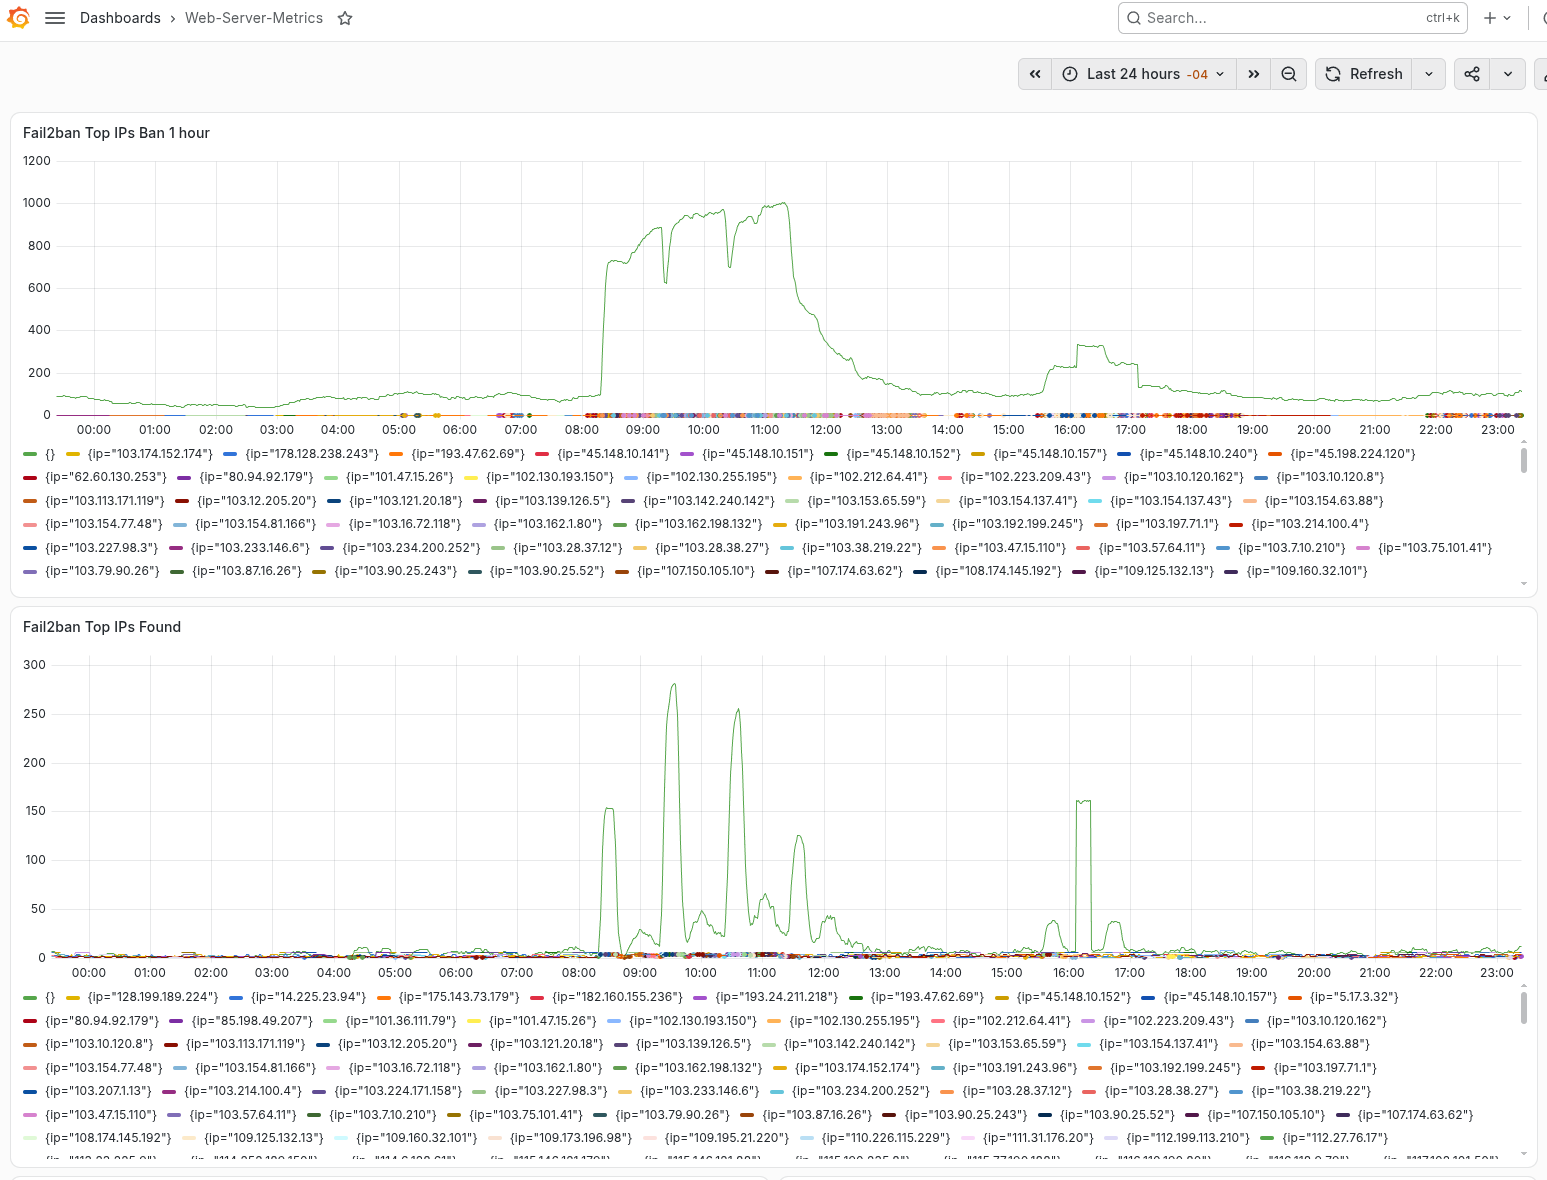
Protection against brute force attacks, it complements the monitoring by showing the automatic defense actions:
- Banned IPs, who was blocked and when.
- Detected IPs, suspicious attempts before the ban.
- Trends, whether attacks are increasing or decreasing.
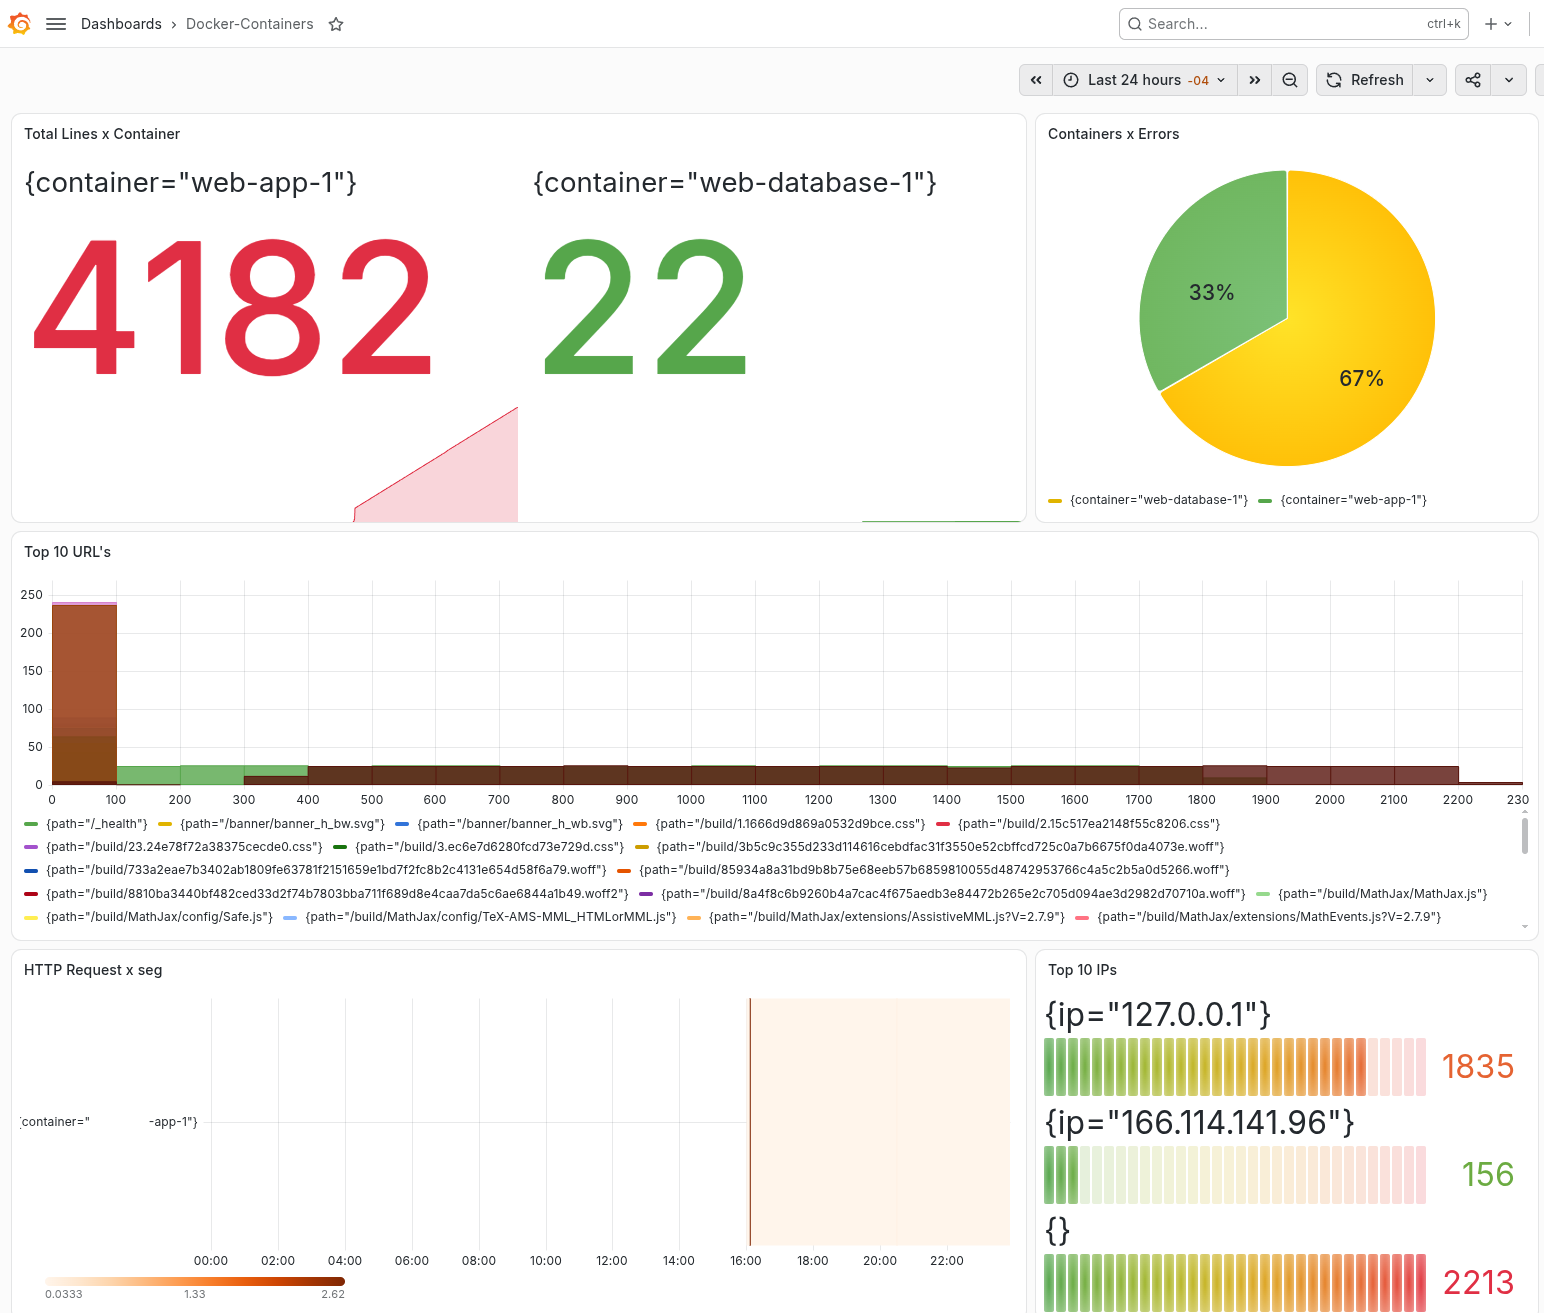
4. Docker
For simple container monitoring, we can ask docker to write its system logs to the systemd journal; with a not-too-complex configuration we will be able to monitor the containers, status codes and volumes.
By default Docker's Logging Driver is configured to "json-file", this setting should be "journald", which can be verified with a few commands.
1# Check the active log driver
2docker info --format '{{.LoggingDriver}}'
3
4# Check whether the daemon config file already exists
5sudo cat /etc/docker/daemon.json 2>/dev/null || echo "daemon.json does not exist yet"
Commonly the "daemon.json" file; if necessary it must be created.
1sudo tee /etc/docker/daemon.json > /dev/null <<'EOF'
2{
3 "log-driver": "journald"
4}
5EOF
If the file already exists with other data, it must not be overwritten; the content must be edited based on the command above. Path of the file to edit /etc/docker/daemon.json
It is recommended to validate that the JSON is correct.
1sudo python3 -c "import json; json.load(open('/etc/docker/daemon.json')); print('Valid JSON')"
Applying changes and verifying the data:
1sudo systemctl restart docker
2docker info --format '{{.LoggingDriver}}' # Output: "journald"
Important note: The system log driver is assigned when containers are created; you may need to recreate existing containers so that they are created with the new driver.
1# For a standalone container
2docker stop <name> && docker rm <name>
3# and launch it again
4
5# If you use docker compose
6docker compose up -d --force-recreate
Finally, the changes must be verified:
1docker inspect --format '{{.HostConfig.LogConfig.Type}}' <name_or_id>
With these details we can create a dashboard for containers as well.
Installing Grafana and its components
The three components are installed from the official Grafana repository via apt on Debian. The .deb packages already include the systemd unit files.
Grafana repository
1sudo apt install -y apt-transport-https wget gnupg
2sudo mkdir -p /etc/apt/keyrings
3sudo wget -O /etc/apt/keyrings/grafana.asc https://apt.grafana.com/gpg-full.key
4sudo chmod 644 /etc/apt/keyrings/grafana.asc
Create the file /etc/apt/sources.list.d/grafana.sources:
1X-Repolib-Name: grafana
2Types: deb
3Components: main
4Suites: stable
5URIs: https://apt.grafana.com
6Signed-By: /etc/apt/keyrings/grafana.asc
7Enabled: yes
We update and install the packages:
1sudo apt update
2sudo apt install -y grafana loki promtail
Configuration files
- Grafana, configuration file at
/etc/grafana/grafana.ini - Loki, configuration file at
/etc/loki/config.yml - Promtail, configuration file at
/etc/promtail/config.yml
Create data directories for Loki
1sudo mkdir -p /var/lib/loki/{chunks,rules,compactor}
2sudo chown -R loki:loki /var/lib/loki
Enable and start services
1sudo systemctl enable grafana-server loki promtail
2sudo systemctl start grafana-server loki promtail
Additional configuration for Loki
Loki's configuration defines how the system logs are stored and indexed.
Key points:
- 7-day retention (
168h): enough for a personal server and does not consume too much disk. - v13 schema with TSDB, the most recent and efficient format for indexing.
- Filesystem storage: ideal for a single server, without the need for distributed storage.
- Telemetry disabled, it does not send usage data to Grafana Labs.
Promtail configuration
Promtail is the agent that collects the system logs; its configuration defines which files to read and how to process them.
The scrape_configs section defines the collection jobs; each job points to a system log source and assigns labels that allow filtering in Grafana:
| Job | Source | Key labels |
|---|---|---|
| journal | /var/log/journal | unit, host, level |
| nginx-*-access | /var/log/nginx/*-access.log | domain, log_type=access |
| nginx-*-error | /var/log/nginx/*-error.log | domain, log_type=error |
| fail2ban | /var/log/fail2ban.log | service=fail2ban |
Important note: Debian 13 (Trixie) no longer includes rsyslog by default. There is no /var/log/syslog nor /var/log/messages. All system logs are managed through systemd-journald, which is why the journal type scraper is used in Promtail to read logs from SSH and other systemd units.
Verifying the stack
Once installed and configured, you can verify that everything works correctly:
1curl http://localhost:3000/login
Project dashboards
The project includes dashboards ready to import:
- Login Users: SSH security with panels for successful and failed logins, top attacking IPs and attempted usernames.
- Web Server: complete monitoring of Nginx and Fail2ban with requests per second, HTTP status codes, top URLs, top IPs and error logs.
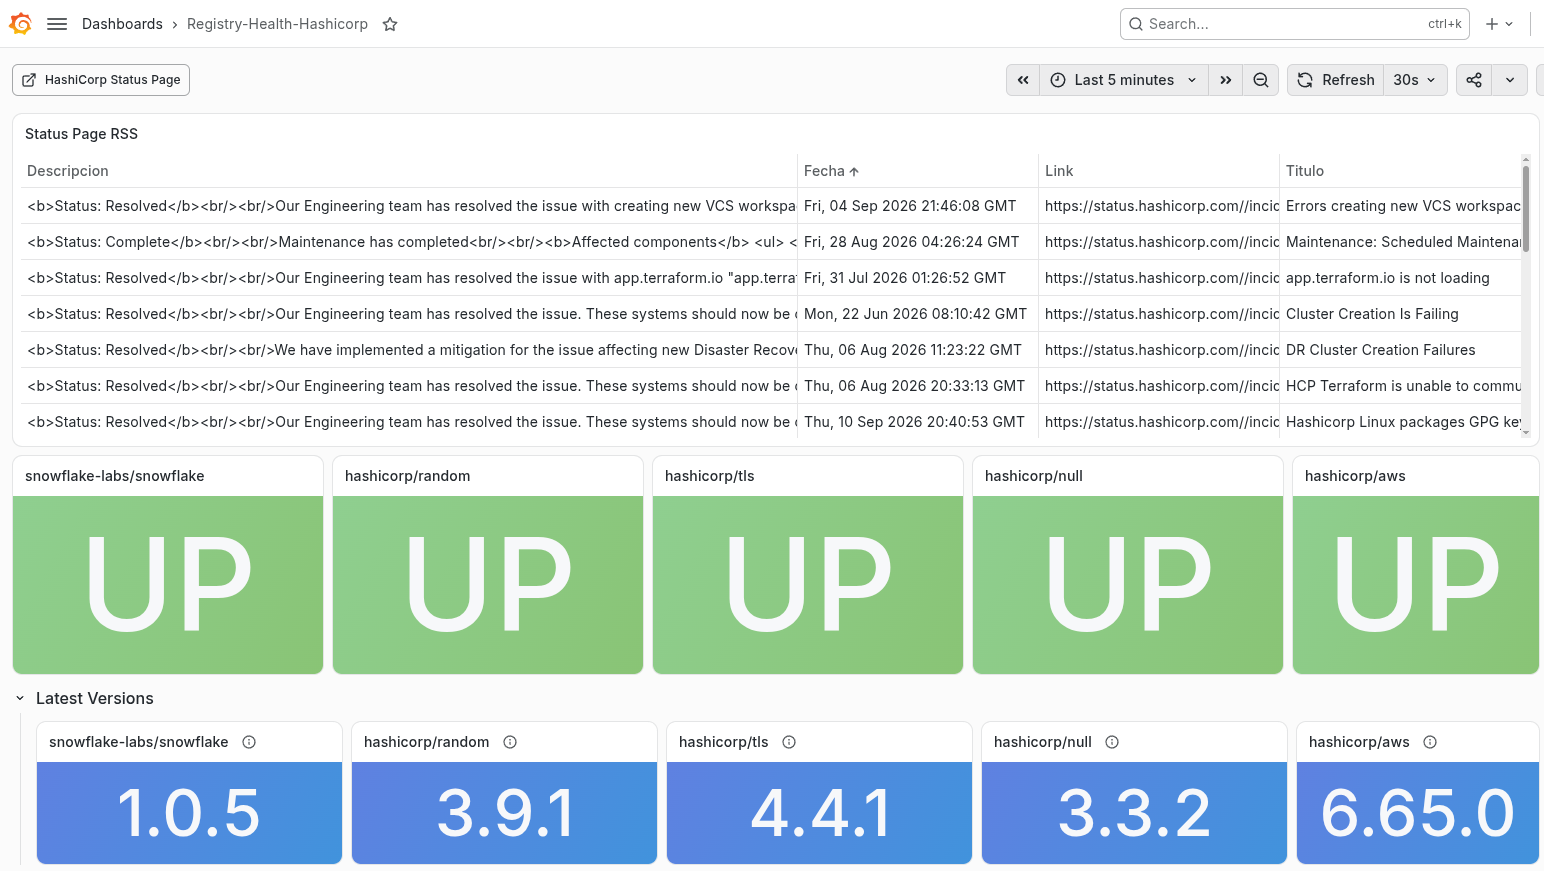
- Registry Health: availability of Terraform Registry providers (using the Infinity datasource).
Scaling to multiple servers
This same solution can be scaled to monitor multiple servers by installing only Promtail on each remote server and pointing it to the central Loki.
You just have to change instance_addr from 127.0.0.1 to 0.0.0.0 in Loki and protect access with a firewall.
Conclusion
You do not need a complex infrastructure to have visibility into what happens on a server. With Grafana, Loki and Promtail you can implement a log-based monitoring system that covers the essentials: access security, web traffic, protection against attacks and certificate status.
The important thing is to start with the minimum. A dashboard with failed SSH attempts and Nginx errors is already infinitely better than having nothing.
How long did it take us? I can say that creating the article took me more time than deploying everything needed:
Server installation and configuration, with Ansible 20 minutes, since I already had a project with everything needed; the monitoring system took around 5 hours and a bit more, since we did not know the tool, so we had to read, test and also ask the AI.
Important note: This article got long; in another one I will leave the configurations of each service, including the Nginx reverse proxy configuration, to give more detail about each setup.